
This is a collection of my notes from the book – Lean Product Playbook by Dan Olsen. I hope it helps some of you in designing great products that customer love.
Product Market Pyramid
Market (Problem Space = customer needs)
Product (Solution Space = Product design)
If no product-market-fit is achieved after multiple iterations -> Pivot

Lean Product Process
- Identify target customers
- Select underserved needs
- Define the product value proposition
- Shortlist MVP features
- Build a prototype
- Test with customers

Target Segment key attributes-
- Needs
- Demographics
- Psychographics
- Behaviors
- Firmographics (for B2B)
Technology Adoption Lifecycle
- Innovators
- Early Adopters
- Early Majority
- Late Majority
- Laggards
User Stories
As a [customer-type], I want to [desire], so that I can [expected benefit]
Importance-Satisfaction Framework
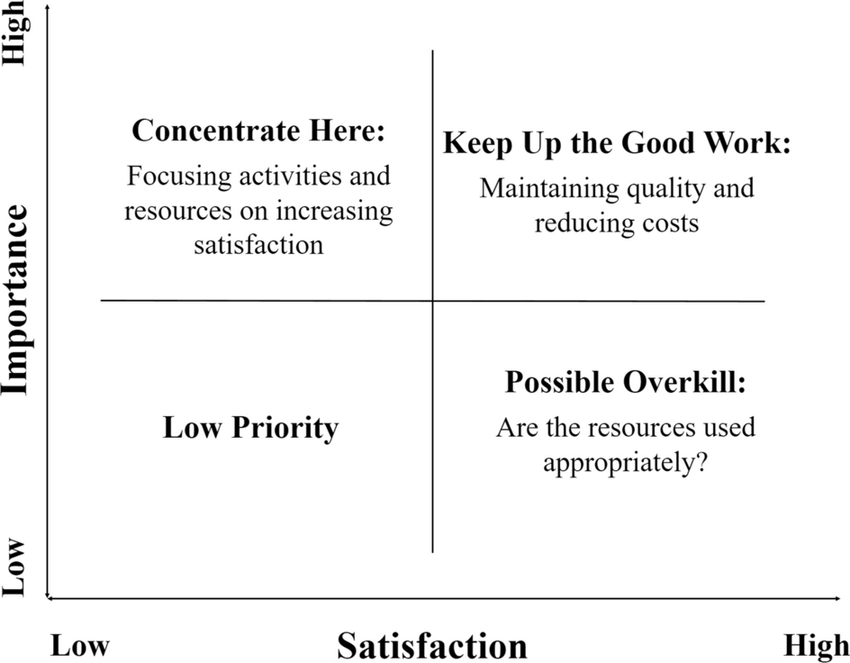
- Focus on improving the Low satisfaction + High importance area (customer value is created here)
- Keep up the good work: High satisfaction + High Importance
Kano Model

Divides needs into three categories for the prioritization of features
Must-haves – create dissatisfaction if not met
Performance based – create satisfaction proportional to being met
Delighters – exceed customer expectations
Product value Proposition – Lean Product Playbook
As per the Lean Product Playbook, we identify the needs to be addressed to create product differentiation.
Must have features essential for the product.
Performance features and delighters => differentiator features.
MVP(Minimum Viable Product)
Select minimum functionality required to validate product design.
Tested qualitatively by direct customer interaction, quantitatively by aggregate results at scale.
User Tests
Teams may get blind to product issues as they work closely on the product.
User tests are done one-to-one with 5-8 customers to uncover blind spots.
Hypothesis-Design-Test-Learn Loop
Enables rapid iterative product development
- Hypothesis – Tries to identify the issue in the problem space
- Design- finds the best way to test this hypothesis
- Test- allows teams to verify their assumptions through customer testing
- Learn- analyzes results to understand the changes needed leading to a better hypothesis
Quantitative Marketing Tests
Tests for improving rate of reaching prospects and converting prospects into customers.
- Landing Page Test: A Landing page is created with product description, explainer videos, features, pricing, sign-up option etc. Critical metric measured is conversion rate.
- Ad Campaign: Placing online ads to target your customer demographic and measuring which words and taglines they find compelling.
- A/B Tests: two alternative designs are tested simultaneously to see how they perform on a critical metric. Web traffic is equally distributed to parallel channels with different versions of design/feature.
- Crowdfunding: Crowdfunding platforms can give us an idea about weather customers are willing to pay for the product or not and how much. Used to reduce risks as customers pay before receiving the product.
- Fake Door: creating mock landing pages to measure customer clicks
used to validate customer needs for a particular feature - Product Analytics: useful to understand where customers spend time and what features they use more/less.
Qualitative Product Tests
Tests for improving product-market fit. Quality of feedback depends on fidelity and interactivity.
Fidelity – how closely the artifact resembles the final product
Interactivity – extent to which a customer can interact with a live, working product
Higher the fidelity and interactivity -> more accurate customer feedback will be.
- Wireframes: low/medium fidelity designs that give an idea about the how various components are arranged in a product. They are devoid of fonts/images/colors etc.
- Manual Hack MVPs: These give look and feel of the original product but are driven by manual workarounds.
- Live Product: Testing finished product with customers. Testing can be done with developers and customers together, or customers alone to gather insights.
Product Metrics – Lean Product Playbook
| CATEGORY | METRIC |
| Acquisition | Number of sign-ups/qualified leads Customer Acquisition Cost (CAC) |
| Activation | Activation Rate Time to Activate Free-to-paid conversions |
| Engagement | Monthly, Weekly, Daily Active Users (MAU,WAU,DAU) Stickiness (= [DAU] / [MAU] ) Feature Usage |
| Retention | Retention Rate Churn Rate Customer Lifetime Value (CLV) |
| Monetization | Net Revenue Retention (NRR) Monthly Recurring Revenue (MRR) Average Revenue per User (ARPU) |
North Star Metric
One metric that captures the core value our product delivers to customers.

Examples for Calculation of Metrics:
- Total Transaction Value = [Average No. of Orders] x [Average Order Value]
- [Average No. of Orders] = [Number of user sessions] x [Conversion Rate]
- [Number of user Sessions] = [Avg. Sessions per user] x [No. of users]
- [Average Order Value] = [Avg. number of Items] x [Avg. Item Value]
- Average Watch time = [Avg. Videos watched in a month] x [Avg. Time spent per video]
- [Avg. Videos watched in a month] = [# of videos watched per session] x [# of active sessions]
- [# of active sessions] = [# of Active Days in month] x [Avg. Sessions per day]

Prioritization – RICE Framework
- Rice Score = (Reach x Impact x Confidence) / Effort
- Reach – # of Users Affected by the decision within the timeframe
- Impact – how much will a feature impact a metric (Massive-3/High-2/Medium-1/Low-0.5/Minimal-0.25)
- Confidence– How confident are we on Reach and Impact scores (High-100%/Med-80%/Low-50%)
- Effort – Man-weeks required for the Decision implementation